

EDDMapS collects invasive species and pest reports from across the United States and Canada. Its dashboards provide different ways to view those reports, check their status, and work with information collected through the platform.
Which dashboard should you use? It depends on whether you want to explore the broader EDDMapS dataset, check your own reporting activity, review incoming reports, or work within an EDDMapS project.
Here is a quick look at four EDDMapS dashboards and what you can expect to use each one for.
EDDMapS Dashboard: Explore Reviewed Data
The EDDMapS Dashboard provides a summary of reviewed EDDMapS data for a selected location and time frame.
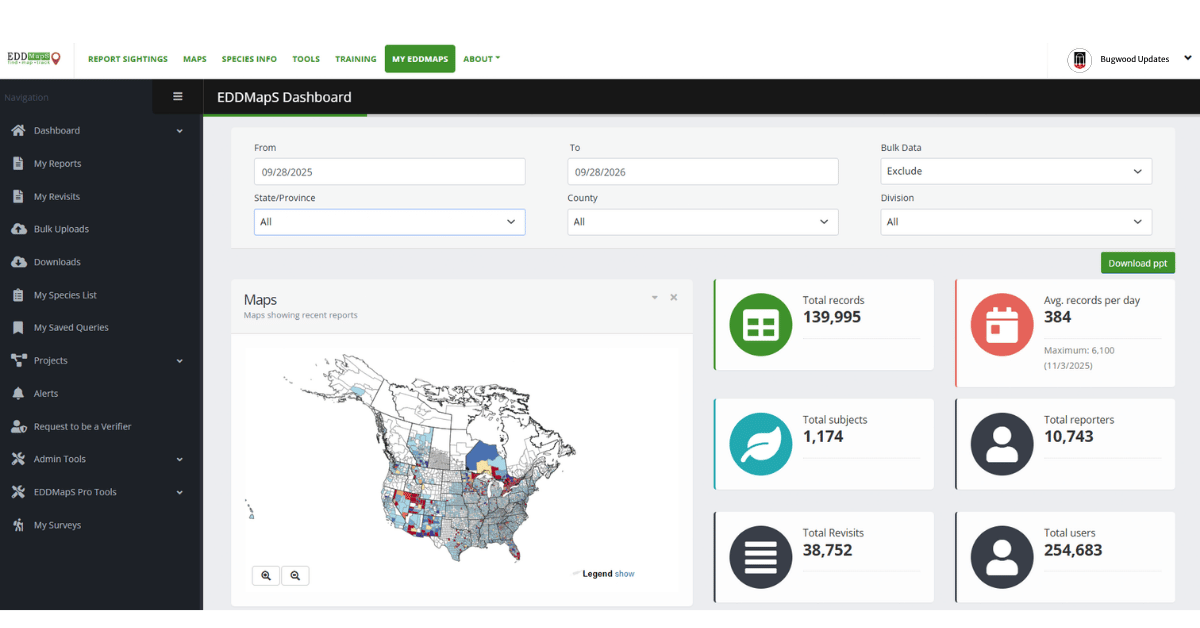
Use this dashboard when you want a broad view of reporting activity in a particular area. The dashboard can help you see:
- What invasive species and pests are being reported
- Who is submitting reports
- Which reporting sources are being used
- What reports have been submitted recently
Adjust the location and date settings to explore the data from different perspectives. You might look at reports submitted within a state during the current year or change the time frame to examine reporting activity over a longer period.
The dashboard provides a summary of submitted and reviewed reports. It does not necessarily show the full distribution of a species or indicate that a species is absent from locations without reports.
To explore the dashboard, select the Dashboards & Tools icon from the EDDMapS home page.
My Dashboard: Check Your Year-to-Date Reporting Activity
While the EDDMapS Dashboard provides a broader view of the reviewed data, My Dashboard focuses on the reviewed reports associated with your account.
Use My Dashboard for a quick look at your year-to-date reporting activity. It shows your report statistics by location and provides a report status table so you can easily check where your reports are in the review process.
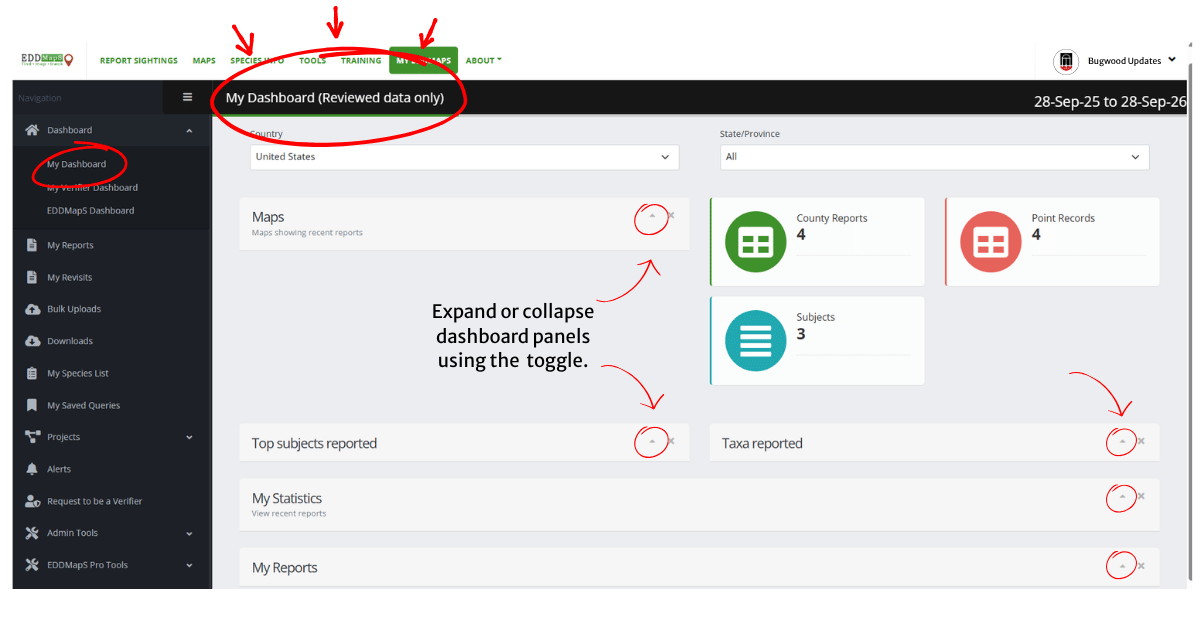
My Dashboard can help you answer questions such as:
- How many reports have I submitted?
- Where have I been reporting?
- How many different species have I reported?
- What is the current status of my reports?
- Which reports have I submitted recently?
This dashboard is also a starting point for accessing and managing your EDDMapS reports. Click “My EDDMapS” on the website’s main menu to go to the dashboard. You must be logged in.
My Verifier Dashboard: Statistics on your Record Reviewing Activity
My Verifier Dashboard serves as a summary of record reviewing activity for EDDMapS Verifiers. EDDMapS Verifiers are individuals with subject expertise who evaluate submitted reports for accuracy and completeness. Their work is an important part of the EDDMapS data review process.
Verifiers use this dashboard to see where they have reviewed records, the subjects they have reviewed, how many reporters they have reviewed records for, and their recently reviewed records.
Because this dashboard supports the verification process, it is available only to EDDMapS users with a verifier role. More information about the review process is available through the EDDMapS training resources.
My Projects Dashboard: Work with Project-Level Information
EDDMapS Projects allow groups to collect and organize reports around a shared purpose. A project may focus on a particular species, geographic area, monitoring effort, outreach campaign, or group of participants.
My Projects Dashboard provides a workspace for EDDMapS users who participate in one or more projects. Users can select a project and time frame to view project and participant statistics, the top reporters and most reported subjects, and recent public records.

Learn more about how EDDMapS Projects organize and support project-level work in the EDDMapS Project Management guide.
Which Dashboard Should You Use?
Each dashboard provides a different view of EDDMapS information:
| Dashboard | Use It To |
|---|---|
| EDDMapS Dashboard | Explore reviewed reports for a selected location and time frame |
| My Dashboard | View your reporting statistics, history, and report statuses |
| My Verifier Dashboard | View statistics on your reviewing activities |
| My Projects Dashboard | View information connected to one of your EDDMapS projects |
Most EDDMapS users will regularly use My Dashboard to follow their own reporting activity. The Verifier and Projects dashboards provide more specialized workspaces for users with additional roles in EDDMapS.
Find the Dashboard That Fits Your Need
EDDMapS dashboards help turn individual reports into information users can explore and put to work. Whether you are viewing your recent record statistics, reviewing reporting activity across a state, checking on your recent verifier activities, or tracking a project’s progress, there is a dashboard designed to help.